Why per-event profit matters
Most craft vendors do a fair, count cash, and feel good (or bad) without knowing exactly what they made. The booth fee was $X, the gas was Y, you sold Z items at various prices. Profit? Roughly.
fiveanddime's per-event P&L turns the rough into the exact. Sales minus cost of goods sold minus booth fee minus mileage equals your real take. Knowing the number tells you which fairs are worth doing again, which to skip, and where you might raise prices. The number requires one ingredient most vendors don't track carefully: COGS, your cost of goods sold.
What is COGS, in plain English
COGS is the dollar value of what it cost you to make or buy each item. It is not the price you charge the customer. If a bookmark costs you $1.50 in wood and finish to make and you sell it for $12, the COGS is $1.50 and your gross profit per bookmark is $10.50.
For most craft vendors, COGS includes:
- Direct materials. Wood, fabric, beads, paint, wire, blanks, whatever physically becomes part of the item.
- Finishing supplies. Stain, varnish, glue, packaging if it's per-item. (If you use a small dab of varnish on each piece, estimate it.)
- Resold items. If you buy something wholesale and resell, the wholesale cost is your COGS.
For most craft vendors, COGS does not include:
- Your time. (Whether to include labor is up to you. Most vendors don't, at first.)
- Your tools, depreciated. That's bigger-picture business overhead, not per-unit cost.
- Booth fees, mileage, table rental. fiveanddime tracks those separately on the Events sheet.
- Electricity, shop rent, etc. Same reason.
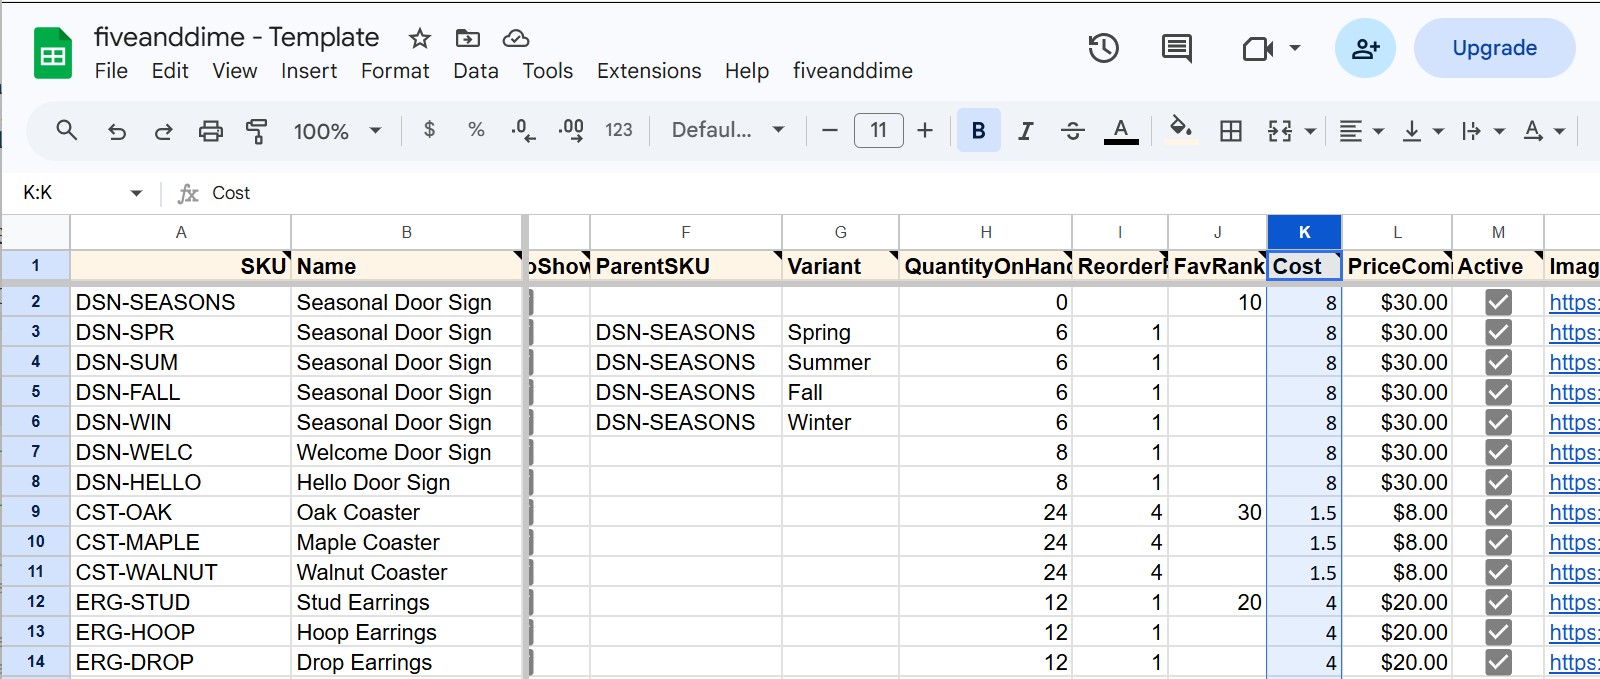
The Cost column in Products_Master is just the per-unit dollar number for the materials that go into one finished item.
Don't stall on this. A rough number now gives you rough P&L now. Refine the number as you learn. Most successful estimates start at "ballpark" and tighten over a few months of selling.
How to estimate COGS if you don't know exactly
For handmade items: divide a batch
The quickest path: total what a typical batch of supplies cost you, then divide by how many finished items it produces.
Example. A 4'×8' sheet of birch plywood costs you $40 and yields about 60 coasters. Materials per coaster: ~$0.67. Add a small allowance for stain and varnish (say $0.20 per coaster, based on how many coasters one quart of finish covers). Round up to $1.00 COGS per coaster.
This is good enough to start. You can refine it later as you track exact yield.
For resold items: use your wholesale cost
The simplest case. Whatever your supplier charges you per unit, that's COGS. If they bill in cases, divide.
For multi-component items: sum the parts
If you make a kit (frame plus insert plus tag plus ribbon), sum the per-unit cost of each component. A scratch column in your spreadsheet is a good place to do the math if it gets fiddly.
If you really don't know: estimate as a percentage of price
For a pure ballpark, handmade goods typically run 15 to 30 percent of retail in materials cost. So:
- $12 bookmark, $2 to $4 COGS estimate
- $30 wooden sign, $5 to $9 COGS estimate
- $8 candle, $1 to $2.50 COGS estimate
Use the middle of the range as a placeholder. Refine as you actually count materials.
Filling in the Cost column
Open Products_Master
In your fiveanddime spreadsheet, click the Products_Master tab at the bottom. Find the Cost column (it's part of the standard schema; check the Help tab if you can't find it).
Fill in COGS for each product
Type your estimated cost into each row. Numbers only, no dollar sign needed. Save (Google Sheets autosaves).
Tip: do a category at a time. Filter to just your bookmarks, then your signs, then your jewelry. Easier to compare cost estimates across similar items.
Pull the new data into the app
In the app, open Settings and tap Pull from Backend Now. The new Cost values come down to the device. (You don't need to do this for the spreadsheet to be correct; it's only for in-app views that show profit.)
Setting booth fees and mileage on each event
Per-event P&L also subtracts your booth fee and mileage. Both live on the Events sheet:
- BoothFee. What the venue charged you for the booth.
- Miles. Round-trip miles from your shop to the venue.
- MileageRate. The IRS rate for the year. Set a default in Settings; events that need a different rate can override.
Check the IRS website for the current standard mileage rate. It changes year to year. Once you put it in Settings, every new event uses it by default.
Business mileage to and from craft fairs is generally tax-deductible for self-employed sellers (Schedule C in the US). The IRS wants a contemporaneous log: date, destination, business purpose, miles. Your Events sheet has all four for every event you record. At tax time, total the Miles column for the year and you have your deduction number with the documentation to back it up. Talk to your tax person about your specific situation; this isn't tax advice.
Reading the per-event P&L
Once Cost is filled and your events have BoothFee plus Miles set, the Reports view does the math:
- Revenue. Sum of (quantity sold × price) for all sales at the event.
- COGS. Sum of (quantity sold × Cost) for all sales at the event.
- Gross profit. Revenue minus COGS.
- Booth fee. The number on the event.
- Mileage. Miles × MileageRate.
- Net profit. Gross profit minus Booth fee minus Mileage.
If Net profit is negative, you lost money on that event. Maybe the booth fee was too high, maybe the venue had no foot traffic, maybe you didn't bring enough product. The number tells you what your gut couldn't.
You sell at a Saturday fair. Booth fee was $50. You drove 30 miles round trip at the current IRS rate (assume $0.70/mile, which is $21).
During the day you sold:
- 22 bookmarks at $12 each (cost $1.50 each)
- 4 signs at $30 each (cost $7 each)
- 3 jewelry pieces at $25 each (cost $5 each)
Revenue: $264 + $120 + $75 = $459
COGS: $33 + $28 + $15 = $76
Gross profit: $383
Booth fee + mileage: $50 + $21 = $71
Net profit: $312
If a similar fair next month has a $200 booth fee instead, the same sales would net $162. Worth it? You decide. The number is what lets you decide.
Common mistakes
If a sale is priced lower than your cost, the per-event P&L will surface it. Sometimes that's intentional (loss leader, clearance) but often it's a math error or stale price.
Stain, varnish, glue, packaging. Each is small per unit but adds up over a season. Estimate even a small allowance.
A 60-mile round trip at IRS rate is $42. Three or four events a month and you're at meaningful money. Track it.
Refine the numbers when you can. The first pass is for getting started; better numbers give better decisions. A quarterly refresh is plenty.
What about labor and overhead?
Most craft vendors don't include their time or workshop overhead in COGS, at least at first. Reasons:
- Labor estimates are uncertain, and uncertain estimates make per-product Cost less useful.
- Workshop overhead (electricity, rent, tools) is real but flat-monthly, not per-unit. Track it in your annual books, not per-item.
- If you want labor in your number, the simplest approach is to pick an hourly rate for yourself, divide by realistic units-per-hour, and add to materials cost.
The Cost column is a single number. Keep it simple. Use it for direct unit cost, and handle the rest at year-end.
Recap
- COGS is the per-unit cost of materials and finishing supplies, nothing else.
- Estimate it from a batch, your wholesale invoice, or as a rough percentage of price.
- Fill the Cost column in
Products_Master. Refine over time. - Set BoothFee and Miles on each event in the
Eventssheet. - The Reports per-event P&L does the rest.
- Negative net profit means rethink that event next year.