Where to find it
In the app, go to Settings, expand Sales reports. The whole reporting experience lives here.
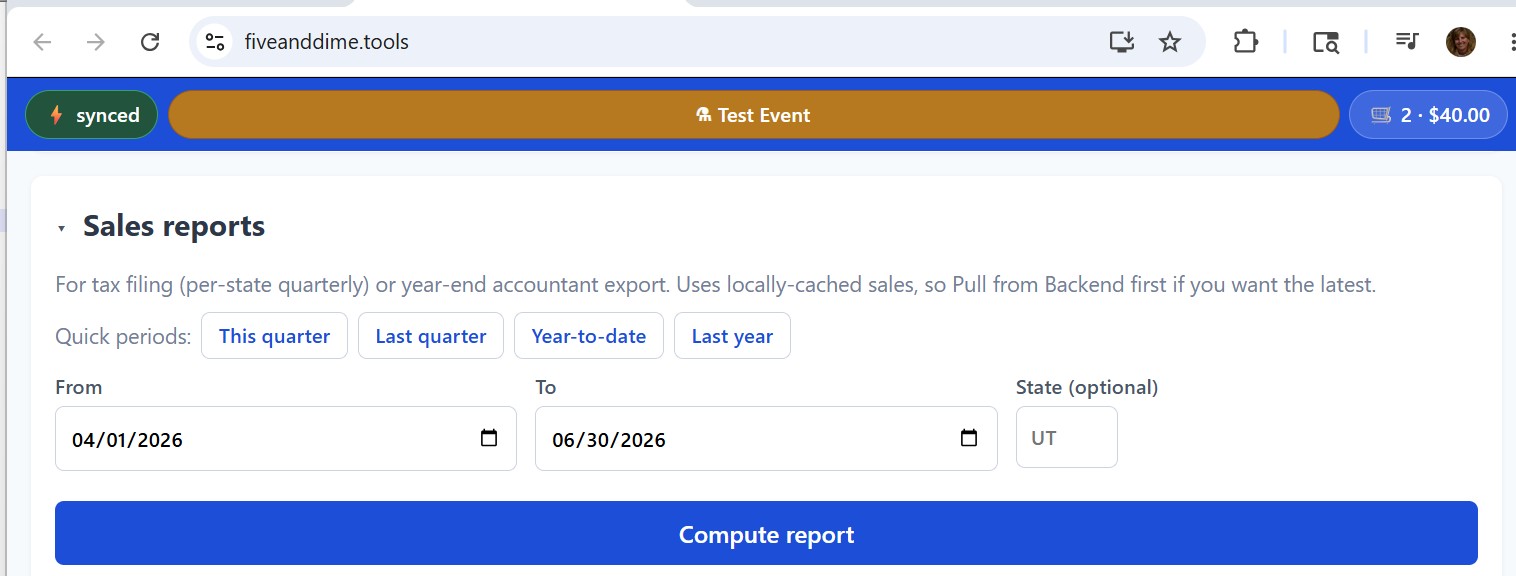
Pick a date range
Three ways to set it:
- Quick periods. Buttons for "This quarter," "Last quarter," "Year-to-date," "Last year." Tap one and the From / To dates auto-fill. Most common path for routine tax filing.
- Custom range. Type or pick dates in the From and To fields directly. For one-off questions ("how did the December markets go?") or filings that don't align with calendar quarters.
- One event only. Set From and To to the same date as the event. Useful for after-event "how did I do tonight" reviews; though the Events tab also shows per-event totals more conveniently.
Pick a state (optional)
The State field filters the report to events held in a specific state. Two-letter code (UT, NM, CA). Leave blank to include all events regardless of state.
Use this when you're filing sales tax in a state you cross into for fairs. Events get their state from the State column on the Events sheet (which falls back to HOME_STATE in Settings if blank). The state filter respects both.
Tap Compute report
fiveanddime computes the report client-side from your locally cached sales. (Pull from Backend first if you've added sales recently and want to be sure they're included.) Results appear below the button. Several sections, each individually collapsible:
What the sections tell you
Summary
The headline numbers for the period: gross sales, taxable sales, tax collected, tip total, total net (after discounts and tax-exempt sales). The first thing your accountant wants to see; also the line items your state's sales tax form asks for.
By state
Only appears when you have events in more than one state. Breaks down gross, taxable, and tax collected by state. Especially useful for multi-state vendors filing in two or three jurisdictions: you can fill out each state's form straight from this table without re-running the report per state.
Includes a "(no state)" row when any events have blank State and no HOME_STATE fallback. Those events get skipped by per-state filters but are still counted in the overall gross.
Per-event breakdown
Every event in the period with its own P&L row: gross, taxable, tax, booth fee, mileage cost (Miles × MileageRate), net profit. The same per-event P&L explained in the Calculating profit per event tutorial, just aggregated for the period you picked.
Sorted by date. Quick way to spot which fairs are worth doing again and which to skip next season.
Top sellers
Per-SKU aggregation across the period: how many you sold, gross revenue, gross profit (if Cost is filled in). Sorted by gross revenue, top 10 by default (with a "show all" option if you want the full ranking).
Manual items (off-catalog one-offs) group by name; their SKU column shows as blank.
By category
Same idea as Top sellers but grouped by Category instead of SKU. Useful for "which categories are pulling weight" or "should I bring more bookmarks next time."
By hour
An hourly heatmap of when sales happen during the day, summed across all events in the period. Tells you when the booth gets busy ("Saturday 2-4pm is my peak") so you can plan demos, lunch breaks, restocking, and second-helper coverage.
Other expenses for period
If you've recorded business expenses in the Expenses sheet (insurance, booth-display materials, software subscriptions, etc.), they aggregate here by category. Not allocated into per-event P&L (those expenses are typically not event-specific), but they show up at the period level so your total net-profit picture stays accurate.
Downloading CSVs
Every section has a Download CSV button. The exported CSV is structured for your accountant or for direct upload to your state's sales-tax e-filing system. Common workflow:
- Set the date range for the period you're filing (most states: quarterly).
- Set the State to your filing state.
- Tap Compute.
- Download the Summary CSV (or whichever rows your state's form asks for).
- Open the CSV, copy the numbers into your state's e-file form.
Per-state tax remittance workflow
Most US states require quarterly sales tax filings if you sell in their state at all. The deadline is typically the end of the month following the quarter (Q1 ends March 31; file by April 30). For each state, the workflow is the same: pick "Last quarter" quick period, pick the state in the State field, Compute, download the Summary or By-state CSV, copy the numbers into that state's e-file form.
Events with blank State that don't fall back to HOME_STATE show up as "(no state)" in the by-state breakdown and get skipped by per-state filters. If you see unexpected numbers in "(no state)," go back to the Events sheet and fill in the State column on the affected events, then re-run the report.
Year-end workflow (for the accountant)
Once a year:
- Set quick period to "Last year" (or your fiscal year).
- Leave State blank (you want the full year).
- Compute.
- Download the Summary, Per-event, Top sellers, and By-category CSVs.
- Hand them to your accountant or import into your bookkeeping software.
The Per-event CSV is the one most accountants want first: each row is one event with revenue, cost, expense, and net profit columns. Drops cleanly into Schedule C / Form 1040 / your state's equivalent.
"Did I file this already?"
fiveanddime doesn't track filing status because the actual filing happens on your state's website, not in the app. The simplest habit: keep a folder on your computer or in Drive called "Tax filings" with subfolders per quarter, drop the downloaded CSVs in, and your filing history is right there in chronological order. Done is when you see the CSV in the folder.